Pages

Welcome to Alexis T’s Math Analysis Blog

Welcome to Alexis T’s Math Analysis Blog
Join me on my fabulous trip through Math Anaylsis!

Wednesday, June 4, 2014

BQ #7: Unit V: Derivatives and the Area Problem

1.  Explain in detail where the formula for the difference quotient comes from now that you know! Include all appropriate terminology (secant line, tangent line, h/delta x, etc).

The difference quotient is a common expression in calculus. It is used during the concept of derivatives. The formula is 

(http://www.jcu.edu/cspitzna/joma/livemath/diffquo.htm)

But I bet you're wondering how this equation is derived! Well it's easy!
(http://cis.stvincent.edu/carlsond/ma109/diffquot.html)

The difference quotient is used to find the value of the slopes and curves of all tangent lines. Remember that the slope formula is (y-y)/(x-x), this is also known as the rise over run when looking directly at a graph so we can find it much easier. There are also two types of graph which is one with a tangent line, only touches the graph once, and a secant graph, touches the graph twice! In the above picture, it is a secant line graph in which we must get it to a tangent line where only one spot is touched. We get the formula by subtracting the furthest point to the closer one. The y-axis is the f(x) while the x axis is noted as x. "H" is the change of x which can be also noted as "Δx". Our first point is (x, f(x)) while our seond one is (x+h, f(x+h). (We get this point from adding the change of x to x for the total distance on the graph and since y is just f(x), we plug in x which is x+h into it to get f(x+h). So now, plug it into the slope formula of (y-y)/(x-x) and you get [f(x+h)-f(x)]/ [x-x+h]. Once you simplify the denominator (where the x's will cancel out) we get the difference quotient of [f(x+h)-f(x)]/h!

Once we find the derivative by using the difference quotient, it is written as f'(x) or "f prime of x". When you have a derivative, you can find anything, from the value at a certain point to even the tangent line equation, and even the slope value.


To get a full understanding of this concept and example of solving a derivative, please check out IntuitiveMath's video below!


Referenceshttp://www.jcu.edu/cspitzna/joma/livemath/diffquo.htmhttp://cis.stvincent.edu/carlsond/ma109/diffquot.htmlhttps://www.youtube.com/watch?v=iMaJDAV7as0

Tuesday, May 20, 2014

BQ #6- Unit U

1. What is a continuity? What is a discontinuity?


A continuity is a function that is predictable, has no breaks in the graph, no holes, no jumps and can be drawn without lifting your pencil. 

A discontinuity is distinguished in two different groups: removable discontinuities and non-removeable discontinuities. There is only one discontinuity known under the removable one which is called the point discontinuity. At the point of the open circle on the function, it is known as a hole, while the other point (which is closed) is on the same vertical line near it. 


(http://image.tutorvista.com/content/feed/u364/discontin.GIF)

As for the non-removable discontinuity, there are three known as the jump discontinuity, oscillating behavior, and infinitie. In a jump, it's exactly how's named. The graph jumps from one point of a function to another. However, we need to keep in mind that an open/open and closed/open circles work, however closed/closed do not. 


(http://web.cs.du.edu/~rjudd/calculus/calc1/notes/dis6.png)

In an oscillating behavior, there are wiggly lines.


(http://web.cs.du.edu/~rjudd/calculus/calc1/notes/dis3.png)


For infinite discontinuities, it is known as an unbounded behavior that occurs when there is a vertical asymptote.

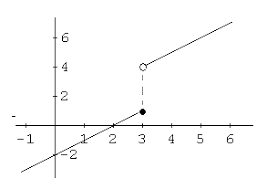
2. What is a limit? When does a limit exist? When does a limit not exist? What is the difference between a limit and a value?

A limit is the intended height of a function. A limit exists when the same height is reached from both left and right hand limits. It also exists when a grpah does not break at a given x-value. Last, it can also exist if your ultimate decision is a hole in the graph (point discontinuity). However, a limit does not exist when there are different left and right hand limits (jump discontiuity). It also does not exist when it is unbounded because infinity is not a number. Last, it doesn't exist when it doesn't approach any single value. The difference between a limit and a value is that a limit is the intended height of a graph while a value is the actual height. When you look on a graph, it can be represented by open or closed circles. Most of the time, the intended height will be represented with open circles while the actual value will be with closed circles. However, remember that a limit and value can be at the same spot on a function!
(http://curvebank.calstatela.edu/limit/grid3.gif)

For example, from this graph we know at x=2, that the INTENDED height is 3, however the actual value is 2.

3. How do we evaluate limits numerically, graphically, and algebraically?

Numerically- We can evaluate limits numerically with a table. By having our given middle value, which we can take from the "x approaches a number", that number will be our middle. All we have to do is either add or subtract one tenths depending on which way the limit is coming from. The two answers we get will be our outside answer and all we have to do is add 0's in or 9's depending where you are. To find the value of each number, all we have to do is plug in the equation in the "y=screen" and hit graph and trace the x-values to find the actual values. 

(This example is taken off the SSS packet and the template off the given one online)


Graphically- To solve a limit graphically, we will obviously need a graph. First you need to put your finger on a spot to the LEFT and to the RIGHT of where you want the limit to be evaluated. If your fingers meet, then the limit exists, however if it's does not, then the limit does not exist. This method can be the most useful because there's a visual representation of it which will help some people see it, like the points and different kinds of discontinuity.

Algebraically- When solving algebraically, there are three different "shortcuts" to evaluating your limits. The first method is direct substitution which is exactly what is says it is. You directly substitute the given value of x into the equation and solve. The four possible answers you can get are 1) a numerical answer 2) 0/# which is 0 3) #/0 which is underfined and 4) 0/0 which is the indeterminate form (this means we'll need to use another method to solve it).The second method is dividing/factoring out which can be used if AFTER direct substitution results in an inderterminate solution (0/0). All you have to do is factor out the nomials and hopefully cancel out any common terms to remove the zero in the denominator. Last, there is the rationalizing/conjugate method! Wherever there is a radical, we just take the conjugate of it and multiply it on both the numerator and denominator. The only time we FOIL is with the conjugate denominators. We DO NOT FOIL the non-conjugate denominator because it will eventually cancel out (That's what we want to do!)


REFERENCES: Unit U SSS Packet

Monday, April 21, 2014

BQ#4 – Unit T Concept 3

Why is a “normal” tangent graph uphill, but a “normal” Cotangent graph downhill? Use unit circle ratios to explain.

Both tangent and cotangent's graph direction is due to their asymptotes. Asymptotes lie on the x-axis where x=0. Finding the direction of the graph can be determined by the trig ratio and unit circle.


*color stands for each quadrant in order from 1-4*
(template taken from Unit T Intro Desmo Activity & drawn on by self) 


For tangent, the ratio is y/x. To find the asymptote, x would have to be 0 to be undefined. So when x is 0, we find that the asymptotes lie at (0,1) and (0,-1) which in radians would be pi/2 and 3pi/2. Knowing the asymptotes, we can start on the direction of the graph. Back to the Unit Circle, we know that tangent is only positive in the first and third quadrant and negative in the second and last quadrant. In between the asympotes that we found are the second and third quadrant. Since we know that it's negative in the second, then positive in the third, it goes uphill. The graph will eventually start to repeat itself as the period goes on.

However, for a cotangent graph, it goes down hill. The ratio of cotangent is x/y. Again, asymptotes have a denominator of 0 to make it undefined so we have (1,0) and (-1,0). In radians, it's 0pi and pi. So on our x-axis, these points would be where the asymptote lines are. We know that cotangent is just like tangent in it's positive and negative location. Quandrant I and 3 are positive while quadrant 2 and 4 are negative. We see that the asymptote boundaries are in the first and second quadrant. So it will go from a positive position, down to a negative in the second quadrant. This is how we get our downhill shape.


Friday, April 18, 2014

BQ#3 – Unit T Concepts 1-3


How do the graphs of sine and cosine relate to each other the others? Emphasize asymptotes in your response.
Sine and cosine are both part of the trig ratio and reciprical identities. All the functions have sin/cos in them so that's how they ultimately relate to each other. When a value in the denominator is equal to zero, we know that is undefined and that is where our asymptote is since asymptotes are undefined. 

Tangent? We know the ratio identitiy is sin/cos. On a Unit Circle, we know that the graph is positive in the first and third quadrant while it is negative in the second and fourth. This leads the the graph to have asymptotes at pi/2 and 3pi/2 since that's where cos=0 and we know anything over 0 is the asymptote. From there, the second quadrant starts with a negative and then in the third quadrant, a positive period. This gives tangent the uphill graph.

Cotangent? As for cotangent, the ratio is opposite of tangent (cos/sin). When sin is 0, we find our asymptotes at 0 and pi on the graph. The period start from being positive in the first quadrant to ending in the negative by the second quadrant on the graph. This gives cotangent its downhill graph. Since both tangent and cotangent only cover up pi units in the x-axis, we see it repeats itself right after an asymptote is drawn.

Secant? Secant is the reciprocal of cosine and has a ratio of 1/cos. So when cos is 0, that's where the asymptote lies. This means it would lie at pi/2 and 3pi/2. In the Unit Circle, we know that secant is only positive in the first and last quadrant. That means in the second and third quadrant, it would be negative. To get from a negative to a positive in an instant, we know that an asymptote will be there when the denominator (cos) is zero. This graph follows the pattern of cosine, however, the differences are the asymptotes.

Cosecant? Cosecant is the reciprical of sine and has a ratio of 1/sin. When sin is equal to zero, we know there will be asymptotes. These would be located at 0 and pi. In the unit circle, we know cosecant is negative in both the first and second quadrant and is positive in both the third and fourth quadrant. This graph follows the pattern as sine, however, the differences are the asymptotes.

Thursday, April 17, 2014

BQ#5 – Unit T Concepts 1-3

Why do sine and cosine NOT have asymptotes, but the other four trig graphs do? Use unit circle ratios to explain.

Sine and cosine do not have asymptotes unlike the other four trig graphs. When we refer back to the Unit Circle and find the ratios, we see that sine has a ratio of y/r and cosine has x/r. We know that an asymptote is undefined so that would only mean the denominator has to be 0. However in this case, our denominator will always be r which will never be 0. That is why sine and cosine do not have asymptotes.

For the other trig functions, tangent, cotangent, cosecant, and secant, these have asymptotes. For tangent and cotangent, we know that it deal with x/y or y/x. It is possible that the denominators of the two can be 0 which will make it undefined and result in an asymptote. As for cosecant (r/y) and secant (r/x), we see that the radius is put as the numerator while x and y are on the denominator. Again, they can value 0 which will make them asymptotes. You can notice that when tangent and cosecant both have y as their numerator they land at (-1, 0) or (1, 0). As for cotangent and secant, they both have x for their denominator and the possible points are at (-1, 0) or (1, 0). This is why the other four trig functions are asymptotes.

Wednesday, April 16, 2014

BQ#2 – Unit T Concept Intro

How do the trig graphs relate to the unit circle?

Trig graphs relate to the unit circle by the quadants and the positive and negative values. The unit circle is bascially just unraveled onto a line. Since we know that each quadrant as a corresponding value according to it's trig function, the direction of the graph will follow. For example, sine in a Unit Circle is only positive in the first and second quadrant, then in the third and fourth quadrant, it is negative. When it is drawn out on a graph, we know the position of each parts of the line will either be on the positive side or negative. This means that sine will be on the positive the first two parts, then it will be on the negative side. The image below indicates the positive and negative values in each quadrant for each trig function. Following the color coordination and +/- values, the line drawn below shows where each part of the quadrant exists.

(https://docs.google.com/file/d/0B4NSkh2FgPbXQ2p6dmxpdUVLa1k/edit)
*Drawing and labeling done by me*


Period? - Why is the period for sine and cosine 2pi, whereas the period for tangent and cotangent is pi?

The period of sine and cosine is 2pi because it would take a whole circle to complete the line. We see that both either stay on the positive side or negative side for a good two quadrants. Then, it ends up at where the starting point is. Since the cycle goes through all four quadrants, we know that in a Unit Circle, a 360' would be 2pi. That is why the period for sine and cosine is 2pi. 

The peiod for tangent and cotangent differs. It is just pi. In the image above, it shows how tangent would be graphed on the line. It goes from a positive value, then dips all the way down (representing by an asymptote) towards negative and goes back up the the positive, then back down. From this, we only need to go up to the second quadrant because the cycle repeats itself from there on. In the Unit Circle, we know that the second quadrant goes up to 180', which in radians is just pi. This is why tangent and cotangent's period is pi.


Amplitude? – How does the fact that sine and cosine have amplitudes of one (and the other trig functions don’t have amplitudes) relate to what we know about the Unit Circle?

We know that sine has a ratio of y/r and cosine has a ratio of x/r. The "r", or radius, will always equal to 1. Another thing to remember is that sine and cosine can't be greater than 1 or less than -1 or it would be "undefined". So the only way to divide a number from 1 and get either 1 or -1, is 1. This is why sine and cosine have an amplitude of 1.

Unlike sine and cosine, tangent, cotangent, cosecant, and secant don't have an amplitude. These all have ratios of either x/y, y/x, or r's over x and y. There is no limit to them being 1 since the radius is not on the bottom. In tangent, y/x, the value of the varibles can vary and it is not restricted; it doesn't matter whether it equals to  -1/1. That is why these trig functions do not have amplitudes. 

Thursday, April 3, 2014

Reflection #1 - Unit Q: Verifying Trig Identities


  1. To verify a trig function means to check if the equation is true. To get this, we must get our left side equal to the right side of the equation. Meaning, we already know what the right side is, we just need to get the left side to the same value to verify that the equation is a true statement.
  2. The one important tip I found helpful is using your resources. That means all the videos provided, friends around you, and Mrs. Kirch are there to help you in figuring out trig identities. So even if you think you have the answer, your classmates are a big advantage in helping you check if your solution is correct. Another tip that I found helpful is actually memorizing or getting the jist of the types of identities. The ratio, recipricol, and Pythagorean identites all play a significant role and lays a foundation throughout this unit.
  3. To verify a trig function, there are many steps that can be taken that can differ from one way to another yet still end up with the same results. The first thing I make sure is that my denominators are the same. If they're not, I have to get them to be the same by multiplying the denominator to the opposing parts or multiplying by the conjugate. Another thing I look at is whether I can convert one thing to a different identity to help me verify/solve the trig identity. You always need to make sure to know which identities can power up or power down or do neither! Itis highly suggested that the trig functions in the identities are similar so that it may be crossed off or simplified easily.